Plotting a histogram
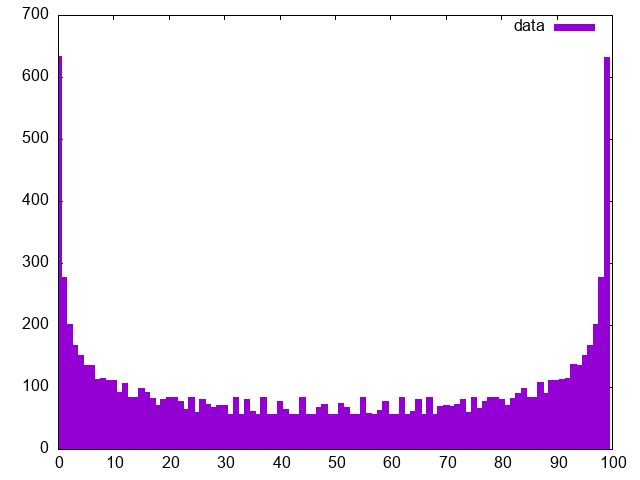
This can be done by computing a histogram in Futhark and then using a box plot. Here we produce some arbitrary values, discretised aong k bins.
def plot k n : ([]i64, []i32) =
  let vs = iota n |> map (f64.i64 >-> f64.cos >-> (+ 1) >-> (* (f64.i64 k / 2)) >-> i64.f64)
  in ( iota k
     , hist (+) 0 k vs (replicate n 1)
     )
> :gnuplot {data=plot 10 10000};
set style fill solid 1.0
plot data with boxes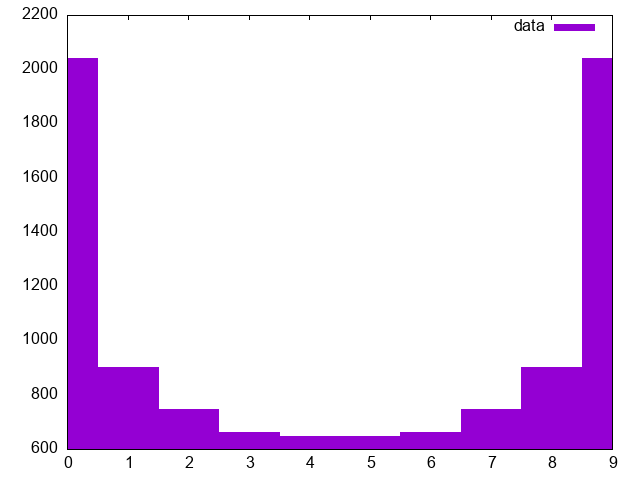
> :gnuplot {data=plot 100 10000};
set style fill solid 1.0
plot data with boxes